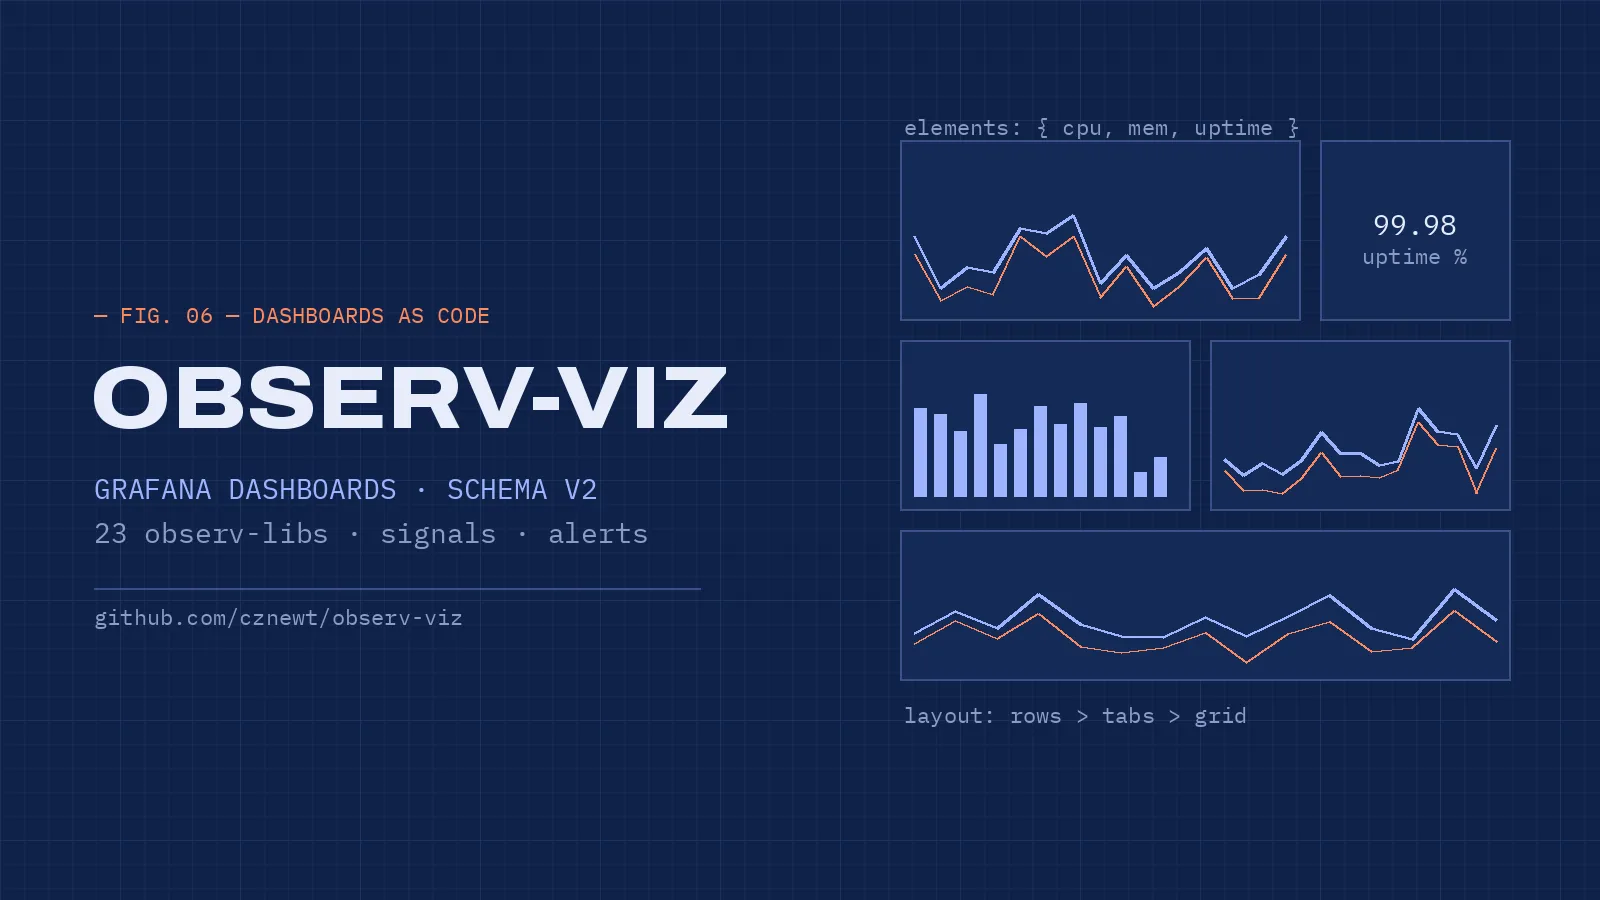
Dashboards as code, for the new Grafana schema
Grafana's dashboard schema v2 (dashboard.grafana.app/v2beta1) changes the model in one important way: panels are defined once as named elements, and layouts (grids, rows, auto-grids, tabs, nested freely) reference them by name. For dashboards-as-code that is exactly the right shape: a panel becomes a reusable building block instead of a copy buried in a panels[] array.
grafonnet, the standard Jsonnet toolkit, targets v1 only and v2 support is not planned. So I built observ-viz, a standalone Jsonnet library in the spirit of grafonnet, but native to the v2 model.
local g = import 'observ-viz/g.libsonnet';
local ds = '${datasource}';

// 1) define a reusable element
local up =
  g.panel.timeSeries.new('Up')
  + g.panel.timeSeries.withTargets([ g.query.prometheus.new(ds, 'up') ]);

// 2) the layout references it BY NAME
g.dashboard.new('Minimal')
+ g.dashboard.withElements(g.element.panel('up', up))
+ g.dashboard.withLayout(
    g.layout.grid.new()
    + g.layout.grid.withItems([ g.layout.grid.item('up', 0, 0, 12, 8) ]))
23 observ-libs for the collectors you already run
Builders alone don't give you dashboards, so observ-viz ships a family of observ-libs: ready-made dashboards, alerts and recording rules for common collectors:
- Runtimes: Go, JVM, Python, .NET, Node.js
- Systems: Linux (full node_exporter coverage, including ZFS, NFS and battery tabs), Windows (all nine windows_exporter collectors), Docker, cAdvisor
- Kubernetes: complete kube-state-metrics and cAdvisor coverage
- Databases: MySQL, PostgreSQL, Redis, memcached, etcd
- The monitoring stack itself: Prometheus, Loki, Mimir, Tempo, Pyroscope, Alloy
- …plus shared alerts and logs libraries, and a few home-lab treats (Syncthing, UniFi, WireGuard).
All of them build on a common signal engine with about fifty panel presets, so the boards stay consistent: units, thresholds, annotations and drill-downs come from one place. Rendering a full package takes one command:
docker run --rm -v "$PWD":/work \
  ghcr.io/cznewt/observ-lib render-lib system.linux --validate
# -> dashboards/ + alerts/ + rules/
Built to be extended
- Generated builders: the typed builders are generated from Grafana schemas by a small Python generator, so supporting a new panel or datasource is "drop a schema, run the generator".
- An escape hatch that always works: v2 stores panels and queries as a
kindplus a free-formspec, sopanel.base()andquery.base()cover any plugin immediately, with no waiting for a typed builder. - A pack contract: every observ-lib implements the same interface: signals in, dashboards, alerts and rules out. A template lib scaffolds your own domain pack.
- Patterns and scenarios: RED-style overviews and alert summaries as reusable patterns, and deployment profiles that compose libs into a stack.
- Any pipeline:
.toResource()emits the full resource envelope for grafanactl or the Kubernetes operator,.toSpec()the bare spec for grizzly.
The collection half: alloy-resources
Dashboards assume the metrics are already flowing. The collection side lives in alloy-resources, a library of Grafana Alloy configuration modules and ready-made scenarios (Linux, Windows, Docker, Proxmox, Home Assistant OS, Kubernetes, even a Batocera retro-gaming console), with module categories that mirror the observ-libs: systems, Kubernetes, databases, monitoring backends, cloud, networking. Pair a scenario with its matching observ-lib and you get monitoring A→Z from one pair of repos: Alloy collects and ships the signals, observ-viz renders the boards, alerts and rules that expect exactly those signals.
Try it
jb install https://github.com/cznewt/observ-viz@master, or start from the worked examples and justfiles in the repository. Status: experimental, tracking v2beta1 schema fidelity. Feedback and pack contributions welcome.